Skip to Main Content
https://thedigitallifeindex.publicissapient.com/contact/subscribe-form
Paper-Plane

Transportation

Convenient Connection: High Tech and High Touch in Automotive

November 2020 Edition

Five key findings in transportation, which say people rely more on personal or solo means of transportation, but not enough to buy a car if they didn't have one. Drivers prefer to buy new, despite the cost factor. Consumers plan to buy cars that check their features, not budget boxes. Consumers expect the same connectivity in their cars as they do from their smartphones, and shoppers still prefer to visit dealerships—a big commitment requires a high touch experience.
Transportation

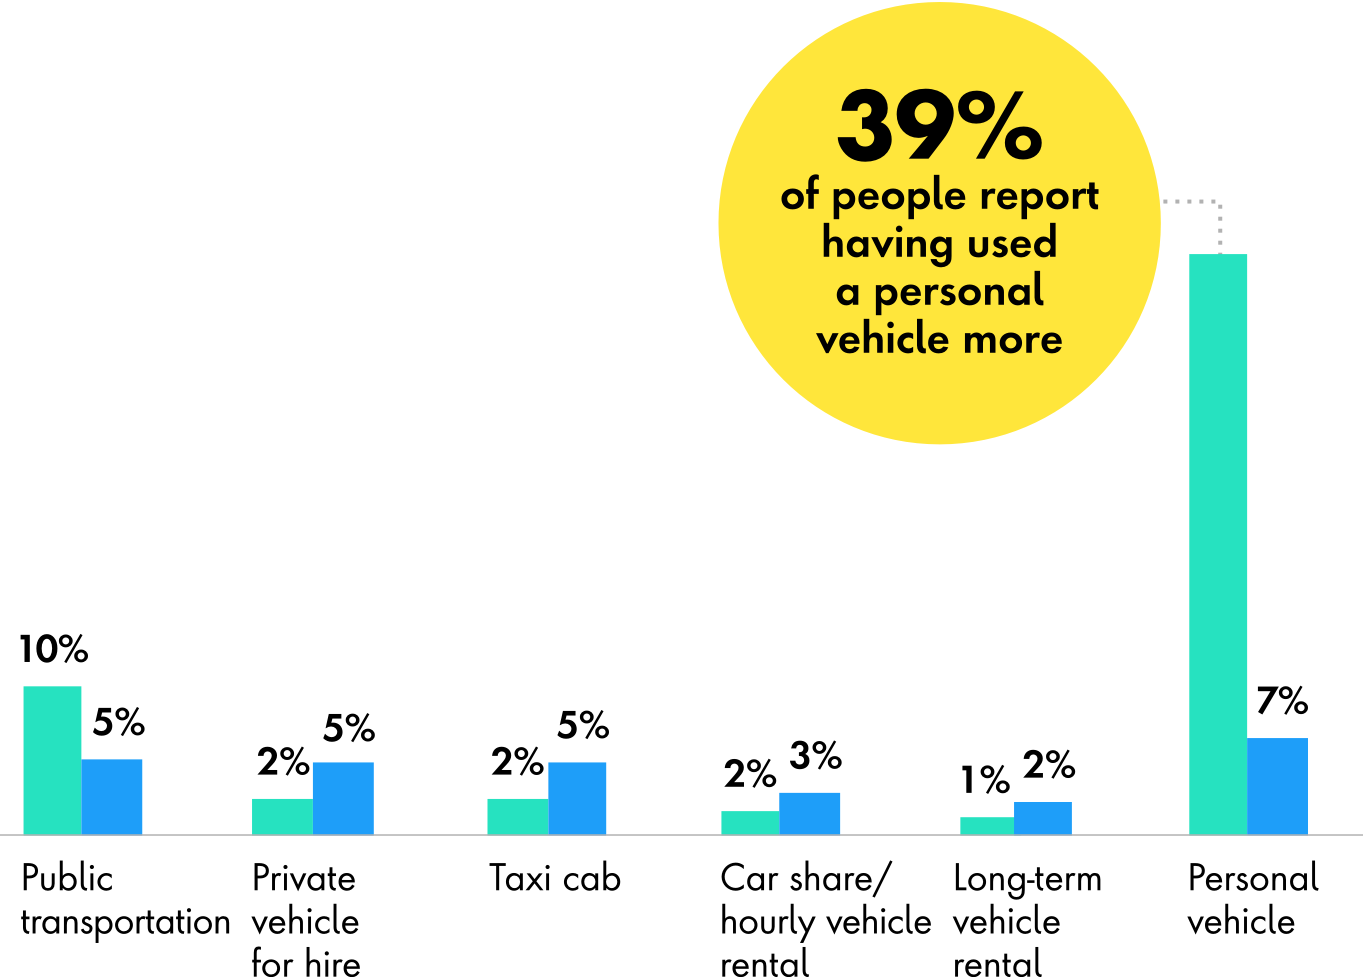
People will always need to get around, even as remote work and learning become the norm and retailers and restaurants master delivery. Lock-downs and restrictions due to COVID-19 have affected how often and which modes of transportation people take, but in the end, we can expect people to return to the routine method of transport they relied upon pre-pandemic.

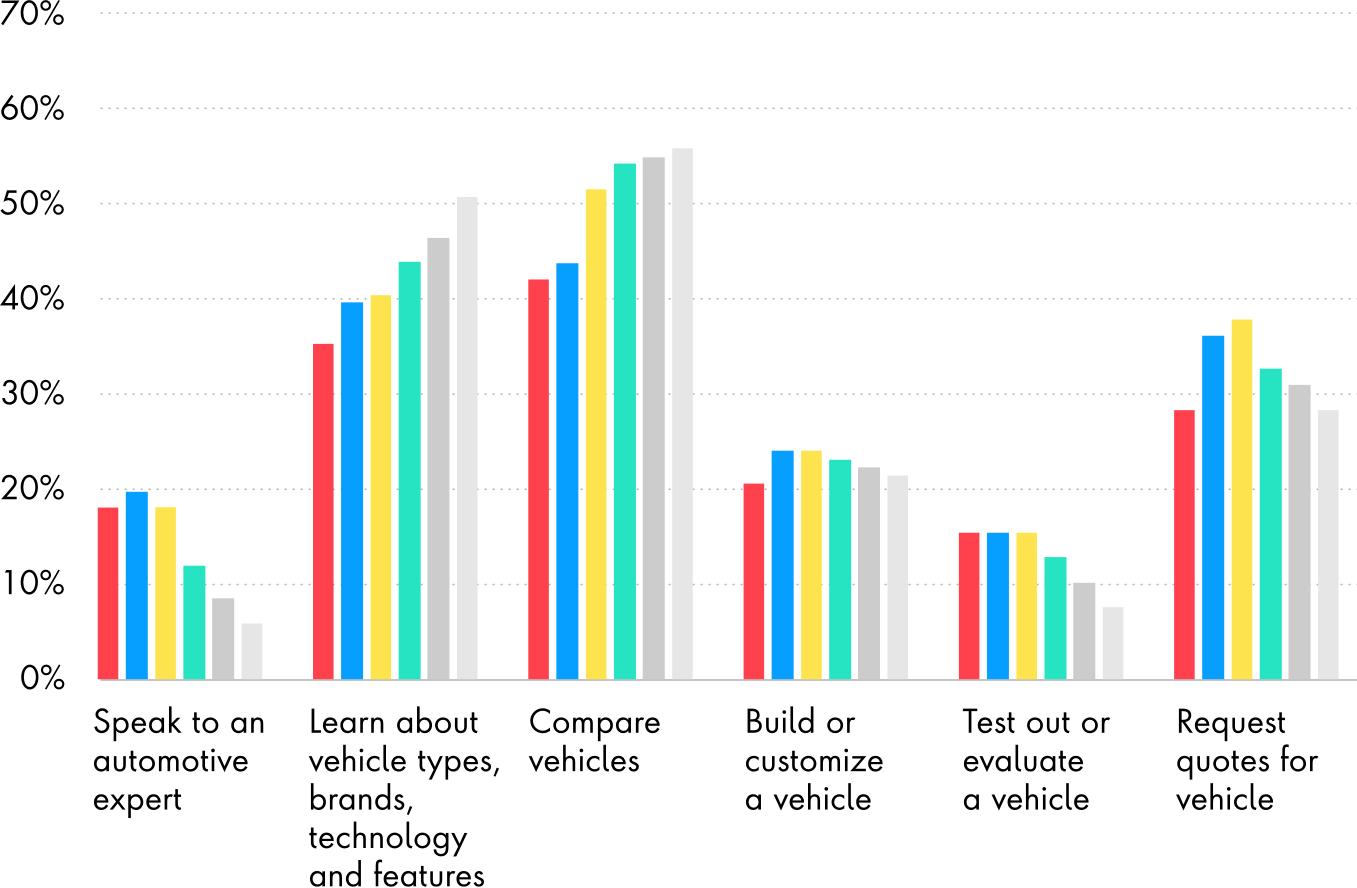
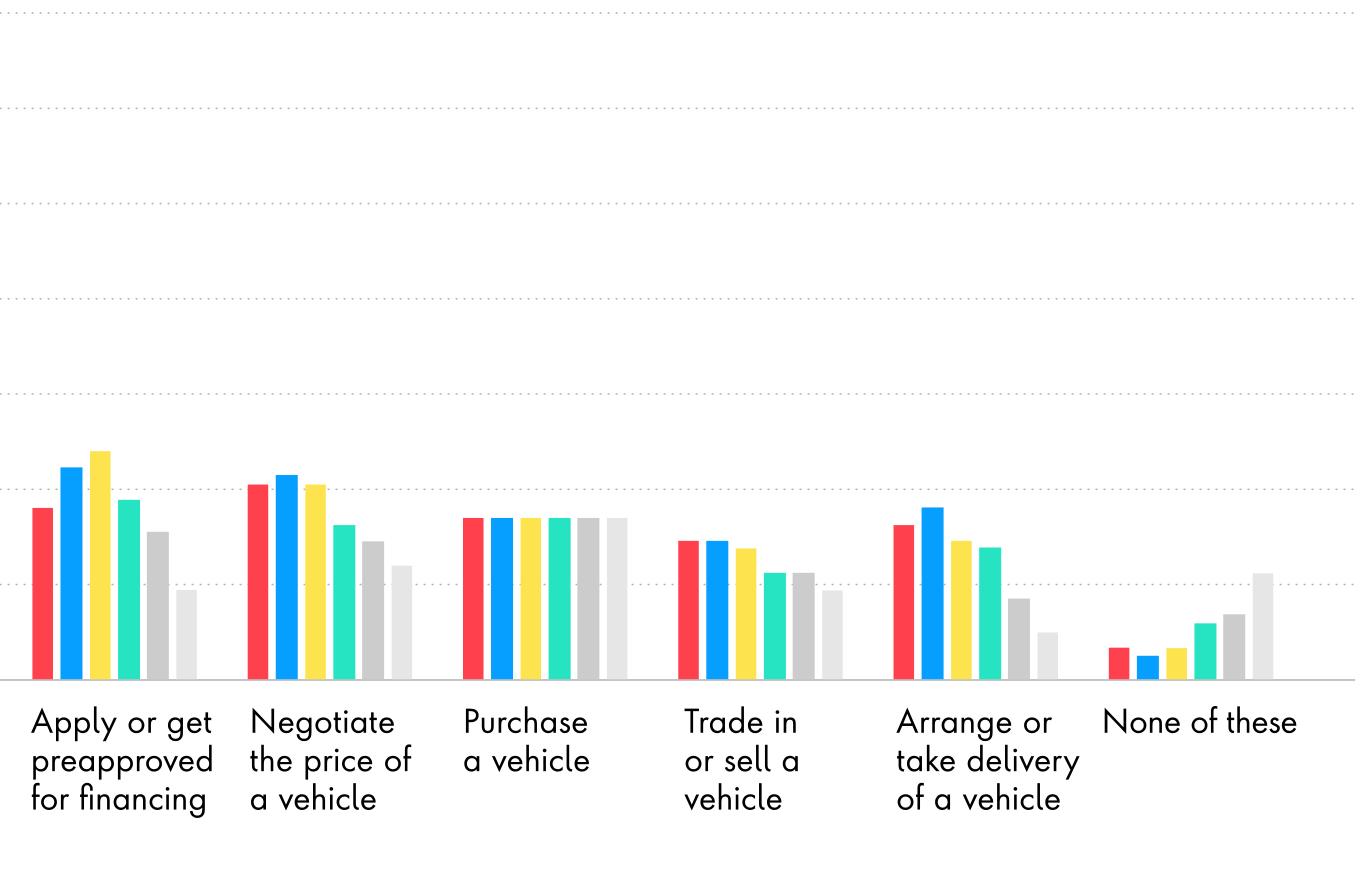
And when it comes to their cars, people crave connectedness – within the vehicle itself, to their lifestyle and the world around them – and with their dealers. As technology progresses, people expect their car to do the same. They believe automakers are committed to making greener vehicles. Many people require fuel efficiency in their vehicles and comfort levels with hybrid and electric vehicles continue to grow. Globally, people still prefer to rely on dealers to help them learnabout, compare, test and pay for vehicles.

The transportation and automotive industry can foster and deepen relationships with their riders and drivers by demonstrating that they know and understand their customers, integrating online and offline experiences and providing a high level of personal service.

People get in their cars or on their feet due to fear of virus exposure

Throughout the pandemic, personal vehicles see the largest increase in use compared with all other modes of transportation. Thirty-nine percent of people report using their cars more, but only seven percent of people who didn’t use a car prior to the pandemic have started using a car during. The second most common mode of transportation right now? Walking.

Sixteen percent of people who walked as a mode of transportation before the pandemic report walking more, and an additional 16 percent of people who didn’t walk before now do. This trend is seen across all countries surveyed except Singapore, where 39 percent of people report using public transportation more during the pandemic, with personal vehicles and walking close behind.

While the use of personal vehicles has increased during the pandemic, the low number of people who report driving as a new form of transportation and the increase in those who are walking signals that people may be holding off on investing in a personal vehicle despite the fear of virus exposure. Instead, they are likely choosing wait until the pandemic subsides to resume modes of transportation they relied upon previously.

Image of woman using public transportation, with headphones on looking at her phone.

LA Metro aimed to help address the region’s most notorious challenge by increasing the relevance and usefulness of public transportation. They wanted to better serve citizens who had higher expectations, and more alternatives, than ever before. Publicis Sapient provided LA Metro with TAPforce, an engagement layer that turns traditional fare cards into digital accounts, giving patrons access to more mobility options like bike share, parking and microtransit more easily. Now, more consumers can traverse the region more efficiently than ever before, and LA Metro is looking to expand rider options even further through more useful and unexpected partnerships.

Read case study

Increase in use of transportation methods during COVID

  • Chart showing useage of transportation methods during COVID, the single largest use being personal vehicles at 39%, followed by walking at 16%. Remaining modes were nominal.
    Chart showing useage of transportation methods during COVID, the single largest use being personal vehicles at 39%, followed by walking at 16%. Remaining modes were nominal.

Driving speeds up, while buying stays the course

Twenty percent of people say they delayed purchasing a vehicle during the spring of 2020. However, more than half plan to buy a vehicle in the next two years and of those, 34 percent plan to buy a vehicle in the next year. Those in the UAE and Italy are most likely to buy a car in the next two years, while those in Japan are least likely to purchase within that time frame. While there’s no doubt COVID-19 has delayed purchasing in many cases, those delays will not be indefinite.

Approximately when will you buy or lease a vehicle next?

Chart showing when consumers intend to buy or lease their next vehicle. the majority (20%) said more than 2 years out, followed by 1-2 years at 18%.

Of the 46 percent of people who don’t plan to buy a car in the next few years, most already have new cars or their car doesn’t need to be replaced yet. Cost and economic uncertainty are the second most common reasons globally with the exception of Singapore, where 49 percent cite these as their main reasons for not buying a car in the next few years.

Reasons for not buying a vehicle in the next few years
  • Bar chart depicting reasons for not buying a vehicle in the next few years.. 45% said their vehicles don't need to be replaced yet, and 23% said the initial cost was a factor.

Globally, the majority of respondents who buy a vehicle will purchase new (61 percent). Eighteen percent will buy preowned, 10 percent will lease and the rest are undecided. In the United Arab Emirates (UAE), Singapore, Japan and Italy, more than 70 percent of people plan to buy a new vehicle. With people driving more in the medium term, lease mileage caps may be unwanted obstacles. New cars may also present less risk for the dealer and the driver. Those in France, Germany and the UK are least likely to report wanting to buy new and have more of a desire to lease compared to other countries.

Pie chart showing that 61% will buy a new vehicle, 18% will buy a preowned vehicle, and 10% plan to lease a vehicle.

In the U.S., sales of preowned vehicles have spiked due to demand as people avoid public transportation and ride sharing while remaining cost conscious. However, with an increase in demand and decrease in supply (people have delayed purchasing cars, which in turn has limited trade-ins and lease cancellations), used car prices have reached levels not seen in years. This new interest in preowned vehicles may continue through the pandemic, as long as the cost savings outweighs the risk of unexpected maintenance and virus exposure.

  • Chart showing  consumer preference for buy new, lease new, buy pre-owned or undecided by country. UAE, Singapore, Japan and Italy all have the highest intent to buy new vehicles, each showing 70-74% favor buying new.
    Sales Chart Transportation 2
  • Sales Chart Transportation 3

As consumer preferences change and Gen Z enters the car buying market, OEMs are supporting the shift from ownership to usership. Forty-eight percent of people would consider a vehicle subscription program when shopping for a vehicle, whereas only 26 percent would not. Drivers report minimizing total cost of ownership and the ability to exchange or return cars more frequently as the most appealing aspects of subscription services. The rise of flexible solutions like subscription services requires an optimized, seamless customer experience via the likes of digital tools for sign up, model selection, payment, insurance and even home delivery.

How strongly would you consider a vehicle subscription program when shopping for a vehicle?

  • Subscription Chart Transportation 1
    Subscription Chart Transportation 2
  • Subscription Chart Transportation 3

A car with values to match

Respondents who plan to buy or lease a vehicle in the next few years want their new car to better match their values. The most common reason for buying is to own a vehicle that better suits their needs or lifestyle, followed by fuel efficiency and the desire to switch to a hybrid or electric vehicle (EV). However, there are some marked differences between countries. Those in the U.S., Australia, the UAE, Singapore and Japan are considerably less likely to buy because they are interested in switching to a hybrid or EV –they care more about a vehicle that suits their needs or lifestyle, has better fuel efficiency and has safety features. On the other hand, Europeans report switching to a hybrid or EV as the top or one of their top reasons for buying a new vehicle.

Reasons for buying or leasing a vehicle in the next few years

Consumers' continued anxiety around EV cost and battery range

The top two drivers of EV and hybrid vehicle consideration by far are environmental benefits and fuel efficiency. Europeans say that environmental benefits are their top reason for making the switch, while in the rest of the countries surveyed, people report fuel efficiency as their top reason for considering an EV or hybrid.

Top two reasons for considering an EV or Hybrid by country

However, cost and range anxiety are the biggest concerns people have when it comes to the purchase of an electric vehicle globally, followed closely by limited charging stations. At the same time, about a quarter of people cite that increased availability of charging stations and improved battery range are reasons they would consider a hybrid or EV. While there is room to improve in both of these areas, automakers would benefit from providing consumers tools and resources to better understand what EV ownership looks like to make them more comfortable with the switch.

Reasons for considering an EV or hybrid

From A to B: Convenience is king for car owners

65% Stat

Sixty-five percent of people view their vehicle in a utilitarian way – as a way to get where they need to go or convenient for their family’s needs. Forty-five percent of people consider their vehicle as part of their lifestyle – as a reward for their success, to enable their hobbies and passions or express who they are. This sentiment appears across the board. Fifty-seven percent of those in the UAE report their vehicle as convenient for their family and their needs and gets them to where they need to go. Seventy percent of those in France report the same, with the rest of countries surveyed falling somewhere in between.

  • World Chart Transportation 1
    World Chart Transportation 2
  • World Chart Transportation-Legend

This presents an opportunity for automakers to move vehicle perception from utilitarian (“my car gets me from A to B”) to indispensable (“my car is an extension of me”). According to Yotpo’s latest poll, consumers characterized brand loyalty as repeat purchasing, followed by “love” for the brand and preference despite price. To deepen customer relationships, auto brands must focus on providing the best possible customer experience across digital and physical channels. Younger consumers in particular expect exceptional experiences, but they’re also more likely to remain loyal, make repeat purchases and recommend brands to their friends.

Audi City’s digital showroom allows customers to experience the full range of its product line. Using multi-touch tables, buyers pick the options and color they like, then with a swoop of their hand, throw a life-size image of their Audi onto the showroom wall, which can be rotated and viewed from every angle. Enthusiasts can even peek under the hood and chassis to experience Audi engineering. Connections to backend systems provide price and availability. Audi City resulted in 70 percent rise in unit sales, of which 90 percent of customers were new to the brand and 65 percent purchased without a test drive.

Read case study

Drivers require connected tech

The vast majority of people want at least one connected feature in their next vehicle and more than half of people also believe this technology should come standard. Fifty percent of people are willing to pay for it, 20 percent are not and another 30 percent are most likely in the “it depends” camp when it comes to price, value and functionality. Familiar features like backup cameras, navigation and Bluetooth top the list. However, at least 40 percent want features that are less common on base models, such as Wi-Fi, remote vehicle location and self-parking technology. Those in the UAE, Singapore and Italy report requiring the highest number of connected features in their vehicles.

Connected features important to have in next vehicle

While younger people tend to prefer a slightly longer list of connected features, their older counterparts aren’t far behind. This proclivity towards vehicle technology may be due to the popularity of smartphones among all age groups. As people become more comfortable with smartphone technology, they come to expect the same level of connectivity from other products and services as well.

Average number of "must have" features

With vehicle connectivity comes a wealth of data for OEMs. With this data, manufacturers can better understand how their cars are behaving and how their cars are used in order to optimize their product, drive efficiencies and provide a better driver experience. Services like predictive maintenance and insurance packages based on driving behavior and patterns can provide more value for customers while forging new revenue streams (and lower risk) for OEMs. But connectivity also means complexity. OEMs will require a single data platform and tools to store, process and analyze that data and draw insights and make decisions from it.

The dealer is here to stay – for now

While many of those surveyed reported doing initial vehicle research online, most people prefer to do the majority of the car buying process at the dealership. When it comes to initial research, globally, about half prefer to compare vehicles and learn about vehicle types, brands, technology and features online.

And in this case, preferences don’t vary much by age. In fact, the majority of those between the ages of 18 and 24 prefer carrying out all car buying activities at the dealership, rather than online. Those over the age of 45 are most likely to complete the beginning of the journey online and the rest of the journey at the dealership. And those between the ages of 25 and 44 are most likely to be comfortable dealing with aspects around cost online, like configuring their vehicle, requesting quotes, negotiating price and applying for financing. While the dealership is still preferred for the majority of activities, there is growing comfort with online services due to the proliferation of e-commerce and brands like Tesla, which allow customers to configure and purchase their vehicles online.

Preference for online activities

  • Online Activities Chart 1
    Online Activities Chart 2
  • Online Activities Chart Legend

Regionally, those in Italy, Germany, Singapore and the UAE are most likely to report having completed several steps of the buying process online. In the UAE, 32 percent have negotiated price online and another 22 percent have purchased a vehicle online — higher than any other country surveyed. While the dealer is still seen as the preferred point of purchase, those in the UAE and Singapore are more open to purchasing online from the OEM or via an OEM showroom. Globally, 42 percent are willing to purchase online from a dealer, online from the manufacturer, from an online vehicle marketplace or via brand showroom. Twenty-five percent would prefer to purchase from the OEM – either online or by visiting a brand’s showroom.

Purchase channel preference by country

These trends present an opportunity for OEMs and dealers to bridge the gap between the physical and digital experiences they provide. In many cases, data does not flow between OEM, national sales company and dealer. By breaking down these siloes, these parties can usher those researching online more seamlessly down the sales funnel so by the time they visit in person, the dealer knows the customers’ preferences. As the experience improves and car buyers expect more services to go online, the three tiers of automotive sales and marketing will already be ahead of the game.

Shortening the buyer journey will also allow shoppers to skip the dealer and purchase directly from the OEM. While dealer contracts and traditional distribution models often prevent OEMs from doing so, there are alternate methods of going direct-to-consumer. For example, OEMs can work with dealers to set up a central e-commerce hub that integrates into their own website, or establish second brands (like Volvo’s Polestar or BMW’s i) that aren’t beholden to dealer contracts.

The digital life of drivers

2020 has come with major disruption to the way people move about their daily lives. As people shift to different modes of getting around – mass or solo – routines they had pre-pandemic will likely return in the long-term with an emphasis on convenience and lifestyle. Automakers have the opportunity to improve the end-to-end driver experience from pre-sales, sales and after sales across offline and online channels.

Unify data

As drivers require a high level of service on top of more connectivity, OEMs have the opportunity to gather invaluable data to better serve their needs. One data platform will allow OEMs to gather, understand and make better decisions.

Streamline sales

Break down operational and data siloes between OEM, national sales companies and dealers to integrate physical and digital channels. Consider moving more services online to shorten the buyer journey.

Shift perception

Use data to drive better experiences, build loyalty and shift driver vehicle perception from utilitarian to indispensable. Equip dealers with the tools to provide the highest level of service possible.

Provide resources on EVs

Consider providing consumers with more education and tools to increase their comfort levels and ease anxieties around cost, battery range and charge points.

Click here to subscribe and receive a PDF copy of the report.

Receive exclusive people-centric content

Subscribe to The Digital Life Index now and gain exclusive access to the Member Resource Hub, featuring insight-led content to drive your digital future.

Chart depicting gender split demographics of our research, showing 51% Male, 49% Female,

Methodology

Participant demographics

  • Chart depicting age range demographics of our research,  with 24% of the respondents in each the 25-34 and 35-44 brackets, 18% in the 45-54 bracket, and 14% in the 55-64 bracket, with lower ranges in the 18-24 and 65+ bracket.
    Chart depicting demographics of our research, showing employment figuresof a 59% majority being employed full time, 18% part time, with lesser percentages for unemployment and retirement.
    Chart depicting household composition demographics of our research, showing 14% live alone, 19% with a spouse or partner, 30% with children and partner, 5% with roomates,  19% parents, 6% multi-generational and 7% other.
  • Chart depicting household composition demographics of our research, showing 14% live alone, 19% with a spouse or partner, 30% with children and partner, 5% with roomates,  19% parents, 6% multi-generational and 7% other.
    Chart depicting demographics of our research, showing